New Queue Stats Page

IB collects queue statistics locally without sending it anywhere.
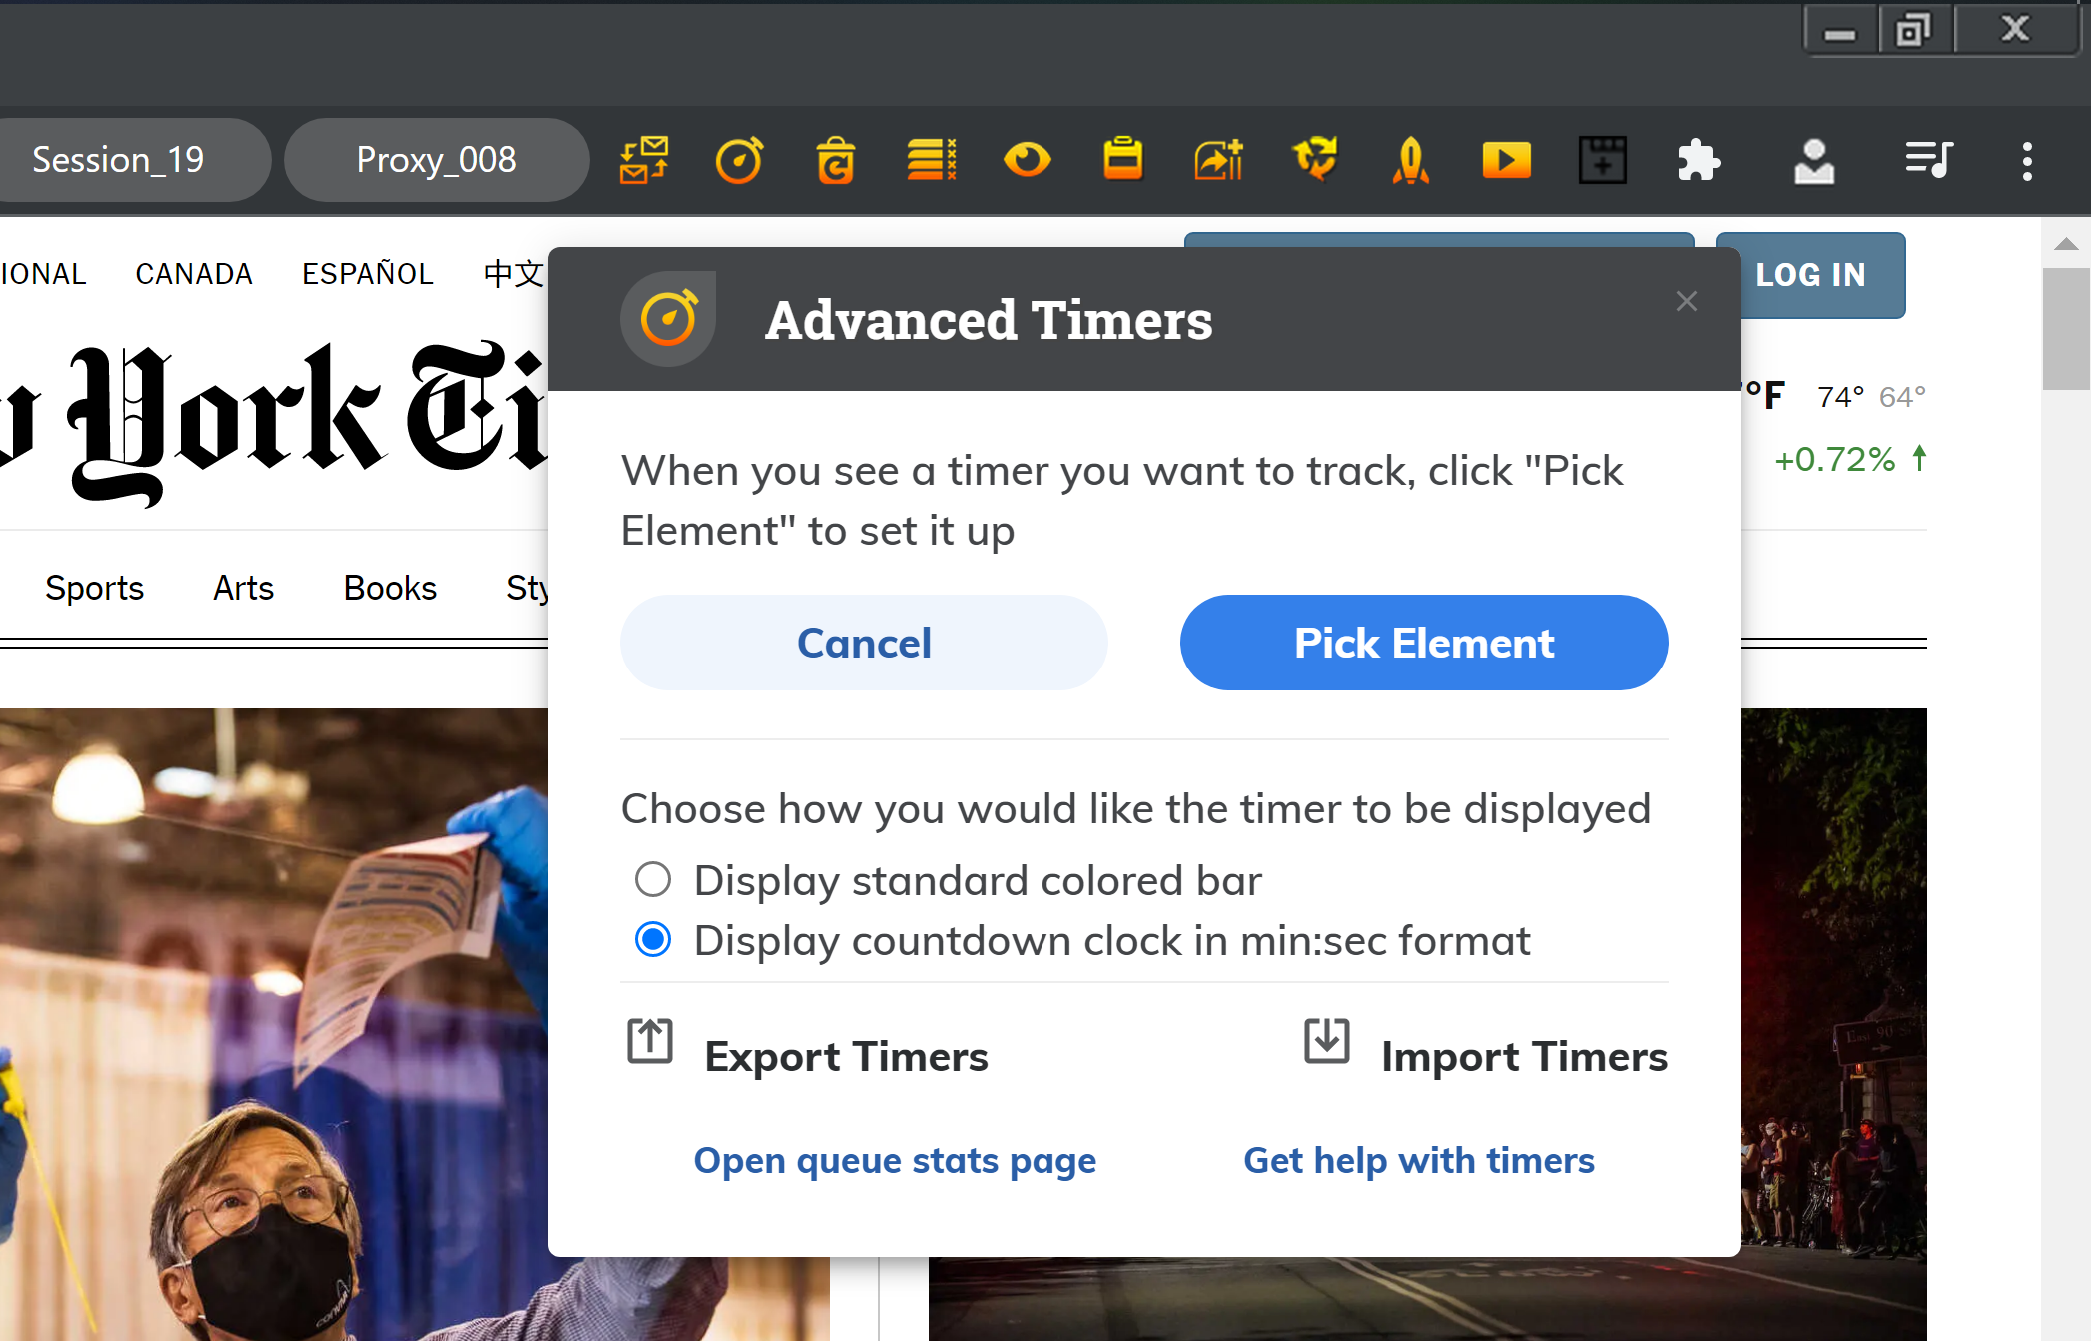
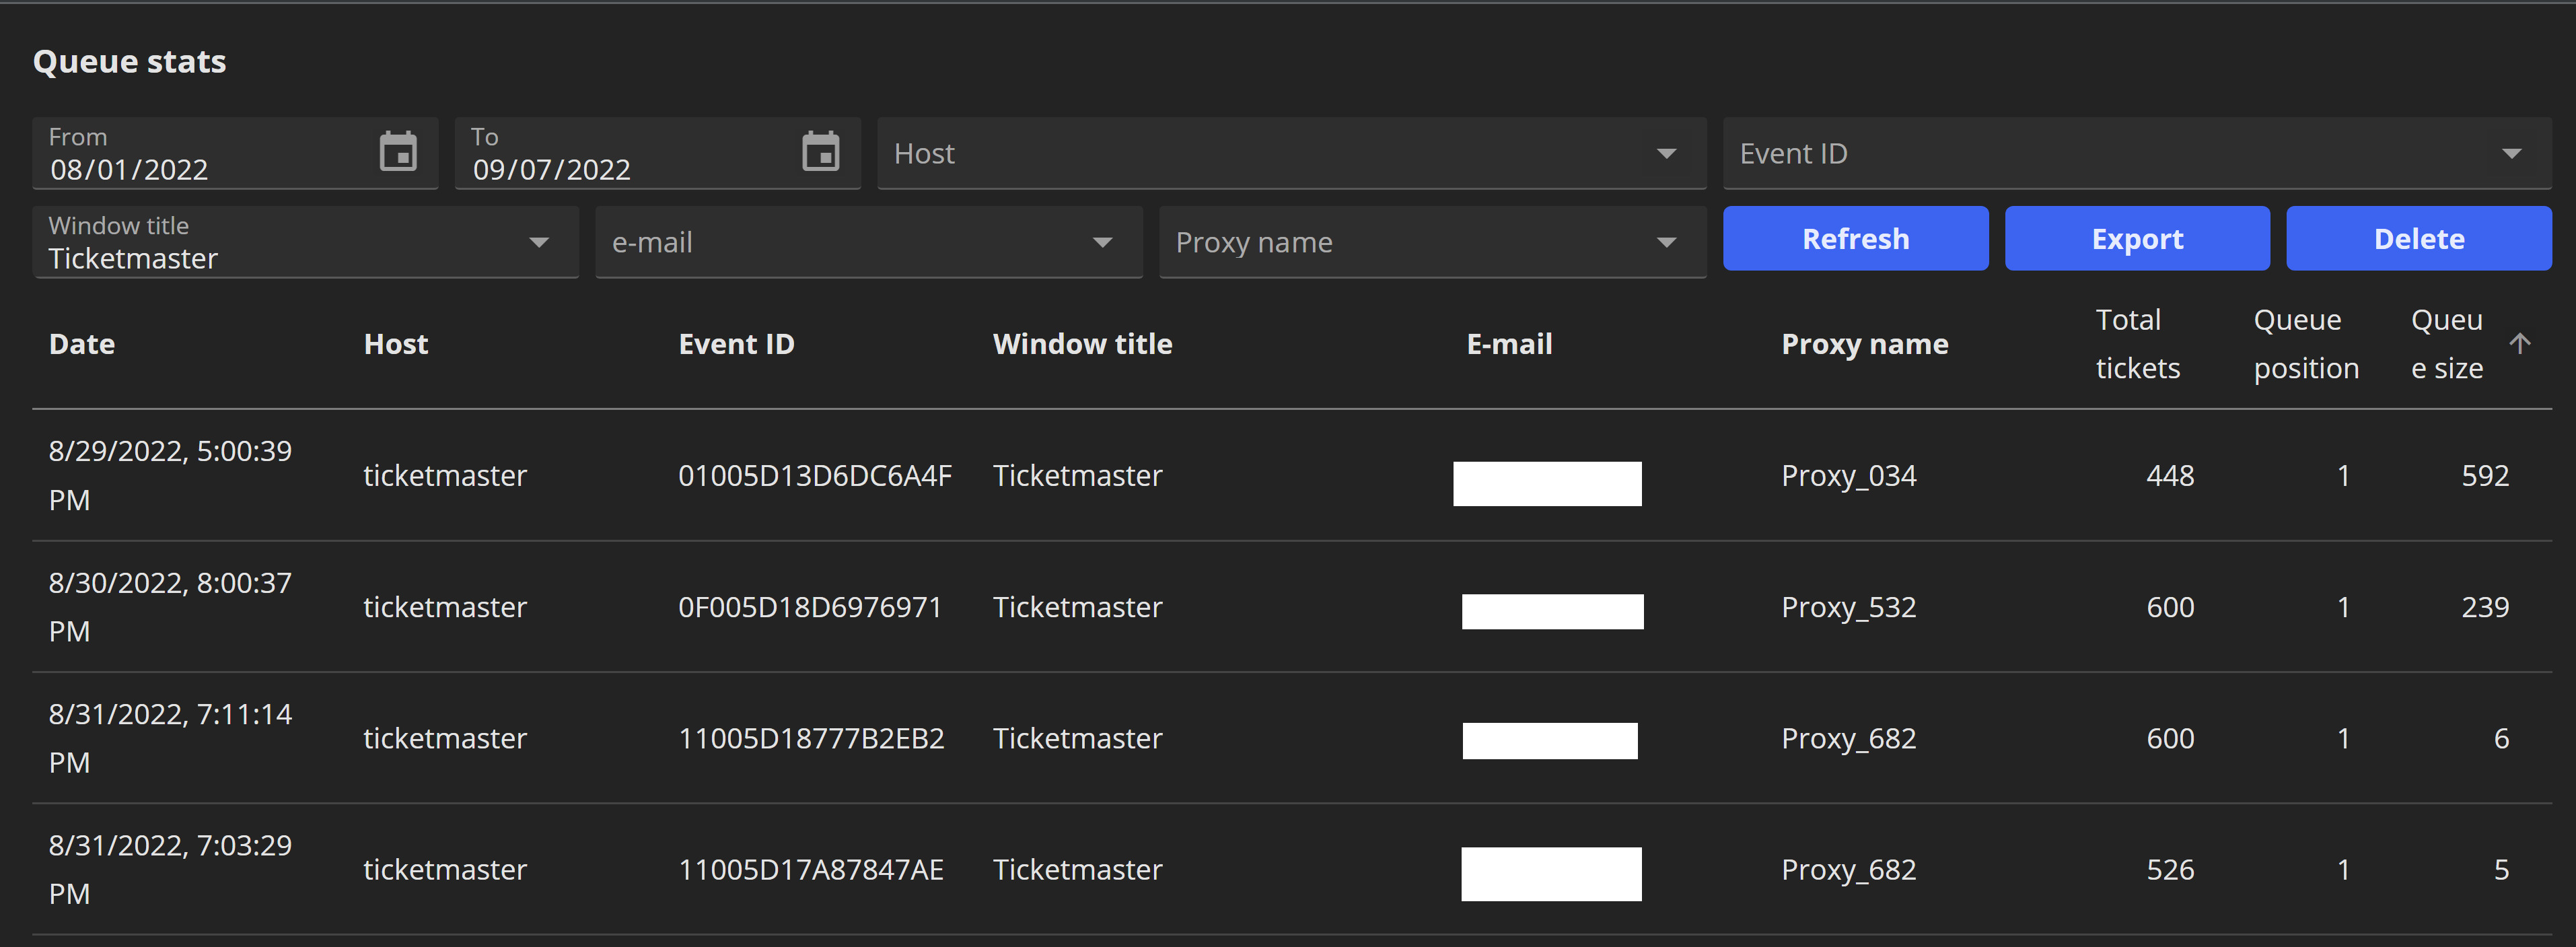
To open queue stats page you need to click on Advanced Timers icon on toolbar on any external web page. Queue stats page opens by default for one day period. It is possible to change that time period using the “From” and “To” input fields.
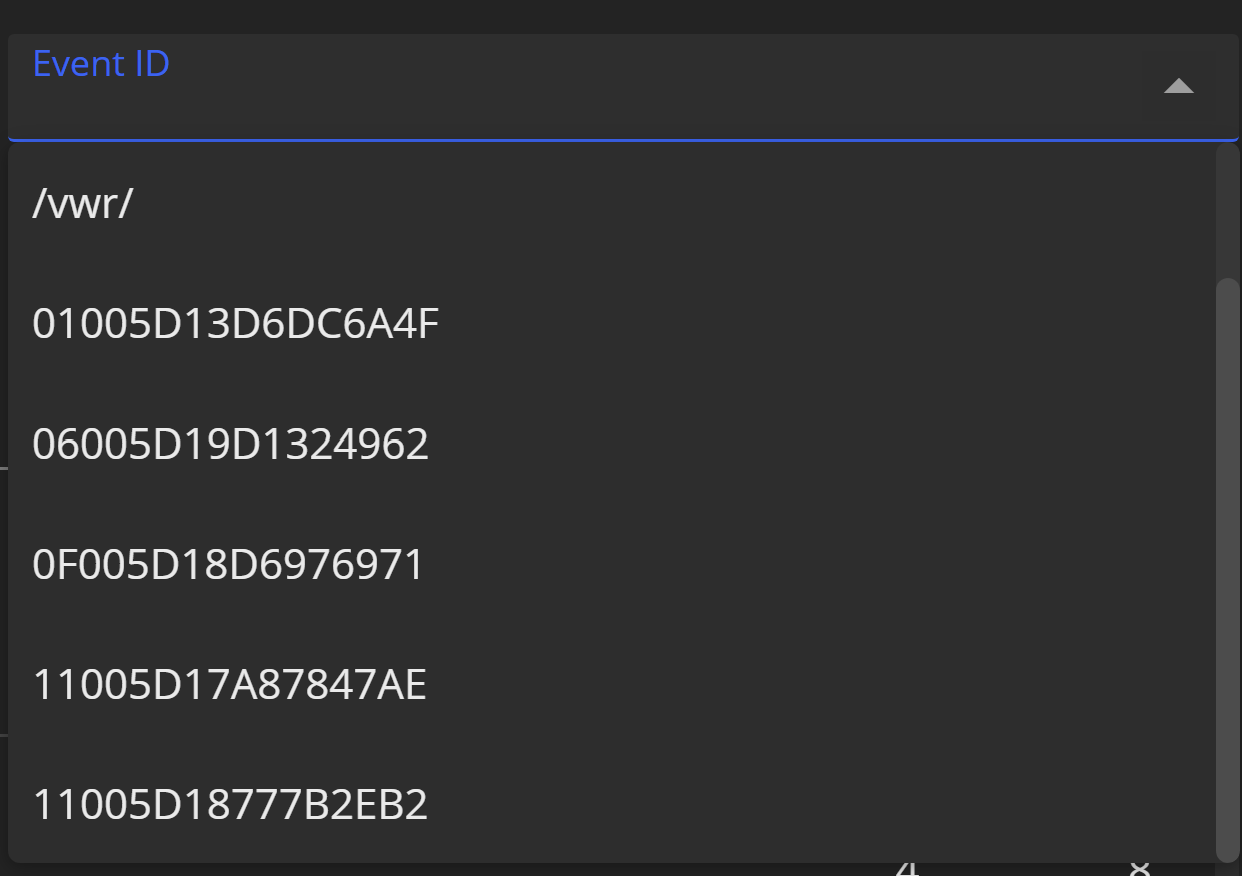
Using different select inputs it’s possible to filter queue stats by host, event ID, window title, e-mail and proxy name. It is possible to sort queue stats by date, host, event ID, window title, e-mail, proxy name, total tickets, queue position and queue size. To sort you need just to click on a column header.
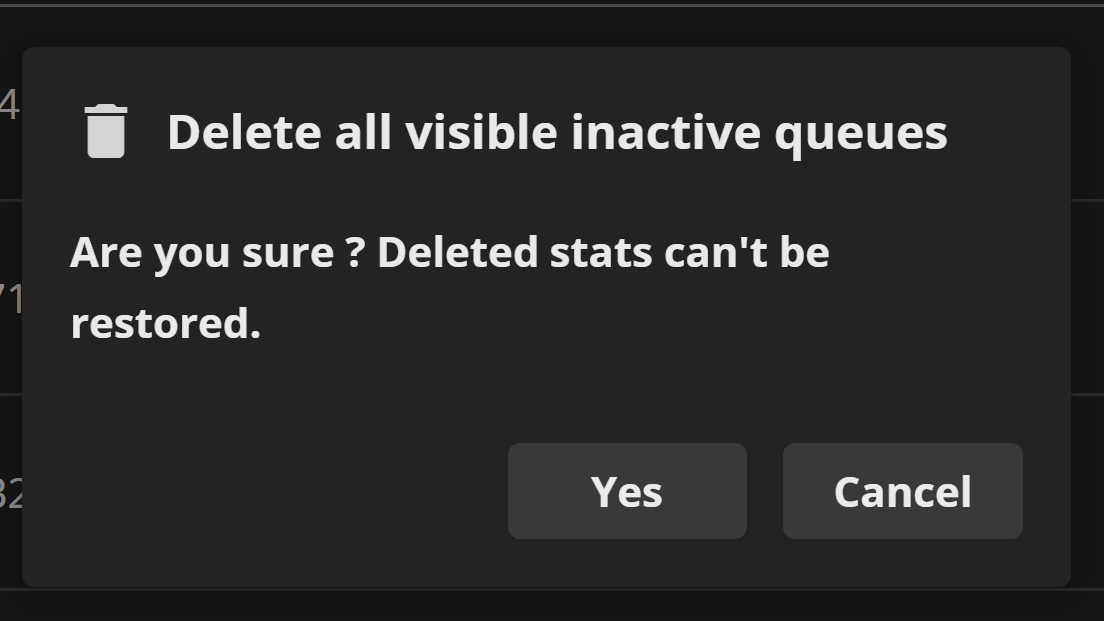
There are three buttons: “Refresh”, “Export” and “Delete”. The “Refresh” button updates queue stats, discarding possible filtering and sorting to their defaults – sorting by date in ascending order without any filter. The “Export” button exports queue stats respecting currently used date range, filter and sorting into a file in a CSV (comma separated values) format. The “Delete” button shows a confirmation dialog, which when confirmed deletes queue stats forever. Deleted data respects currently used date range and filter.
Some indicators require additional explanation. The e-mail indicator shows the last email entered on a tab, before the tab is closed or a new queue is entered. The total tickets indicator shows a max number of available tickets seen on a tab, before the tab is closed or a new queue is entered.


You have to be logged in.